TECHNOLOGY
CMP-MAP
CMP-MAP
CMP-MAP
Optimal fuel efficiency requires the ability to properly track and visualize hull performance in addition to antifouling performance.
CMP-MAP (CMP-Monitoring & Analysis Program) is an analytical service based on a unique monitoring and analysis methodology developed by CMP and drawing on many years of industry expertise.
Its “Triple CMP-MAP Approach” combines three different analytical approaches to visualize hull performance from multiple perspectives.
CMP-MAP is a unique analysis technology developed from CMP’s informed perspective as a manufacturer of ship coatings.

CMP-MAP-based PDCA cycle
Prediction & Planning
Use the analytical results obtained by the “Triple CMP-MAP Approach” along with the fuel efficiency and CII rating data obtained with the PIR simulator to select the optimum high-performance hull coating.
Do
Apply the coating under proper supervision.
Check
Use the “Triple CMP-MAP Approach” to assess hull performance.
- FIR analysis
- Operational profile analysis
- Power analysis
Act
Assess strategies for improving fuel efficiency based on the analytical results.

PIR simulator
PIR simulator runs a simulation using the following information.
1. Basic operational data such as navigation distance, activity rate, and fuel consumption
2. Information on coating film smoothness
3. Information on antifouling performance
Through an integrated analysis of this information, the PIR simulator can estimate fuel efficiency and CO2 emissions, predict CII rating trends, and propose the optimum coating specifications based on these simulated results.

FIR analysis
To understand how hull performance is affected by hull surface roughness, CMP has been conducting ongoing collaborative research into fluid mechanics with Tokyo University of Science, Tokyo University of Agriculture and Technology, Kobe University, National Institute of Maritime, Port and Aviation Technology (MPAT), and National Maritime Research Institute (NMRI).
As part of the Ministry of Land, Infrastructure, Transport and Tourism (MLIT)’s project to support the development of next-generation marine environment-related technologies, and a joint research project with ClassNK titled “Method for Estimating the Change in Vessel Frictional Resistance Based on Reduction in Hull Coating Roughness and Roughness Parameters,” CMP has developed FIR theory ver. 3.0, a 3D portable hull roughness analyzer, and ultra-smooth antifoulings. CMP uses these technologies to verify coating film roughness on-site during the coating process.


FIR theory (CMP patented technology)
FIR theory is an analysis technology for estimating hull frictional resistance by measuring and evaluating the roughness (Rz) and wavelength (RSm) of the surface of the hull coating. Frictional resistance measurements are performed using a double cylinder friction resistance equipment developed by Tokyo University of Science.
Operational profile analysis
The operational profile of a vessel is a key factor in predicting hull fouling and determining the specifications of an optimal antifouling solution.
CMP uses its operational profile analysis software and database (developed in-house) to perform a multi-factorial analysis of a vessel’s operational profile. Using this approach, CMP can visualize the operational status of a vessel from various perspectives throughout the effective life of an antifouling.
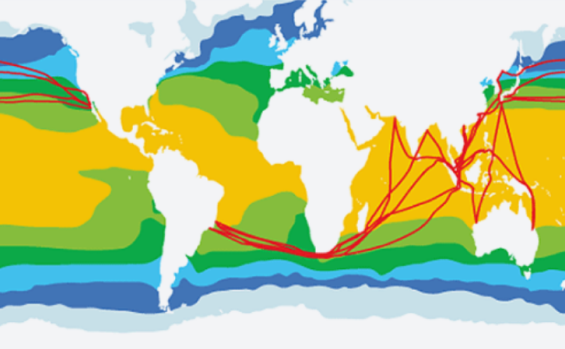
航路
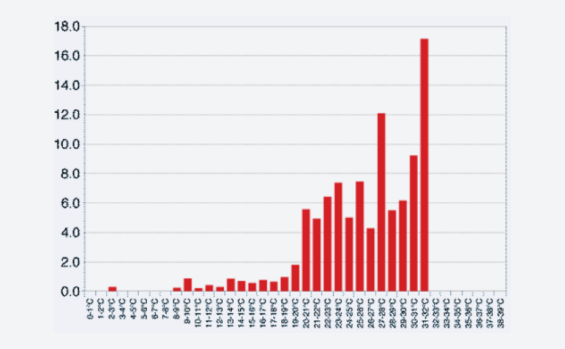
海水温度分布
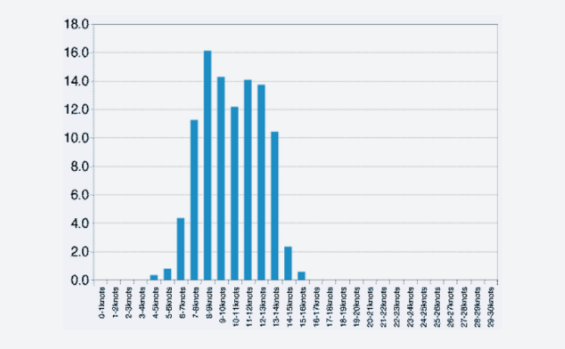
船速分布
稼働率
CMP offers a service where an operational profile analysis driven by big data is used to identify antifouling coating specifications (coating type, thickness, etc.) best suited to the service conditions of a customer’s vessel.
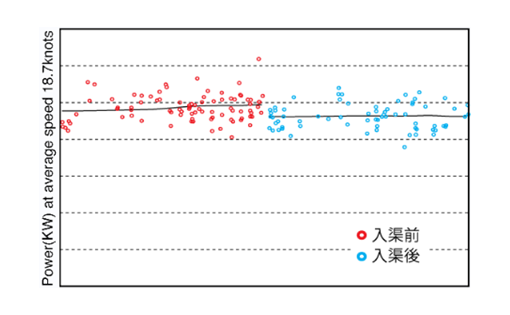
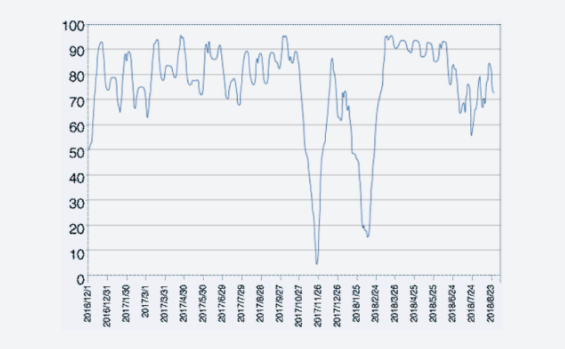
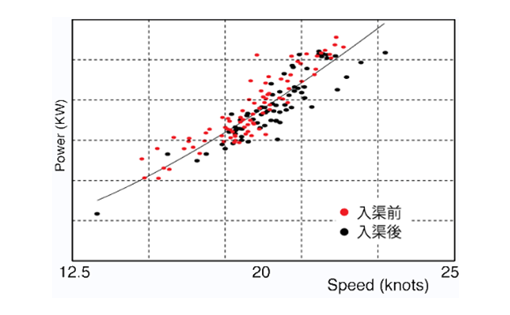
Power analysis
This analysis uses hull monitoring techniques grounded in the approach used by ISO 19030 to obtain a speed power curve, power trend curve, and various performance indicators that provide a quantitative visualization of hull performance.
INPUT
In-service vessel data
- Speed (Log/OG)
- Fuel consumption / shaft power
- Wind speed and direction
- Swell height and spectrum
- Displacement, etc.
OUTPUT
Speed power curve
Power over time at constant speed