SUSTAINABILITY
Water Resources Conservation
Table of Contents
Basic concept
Water resources are limited, and challenges in this area are becoming increasingly apparent primarily due to localized heavy rains and floods, as well as chronic droughts. The situation is expected to worsen in the future due to climate change and population growth. The coatings we produce use only a small amount of water during manufacturing, as we source most raw materials from suppliers. However, since our Group companies require water in the process of manufacturing resins and other materials, we recognize the need to use the limited water resources efficiently.
Management structure
The Sustainability Committee’s Resource Utilization and Pollution Prevention Subcommittee collaborates with relevant domestic business departments to manage water withdrawals in our operations, aiming to maintain and improve water use efficiency. Overseas, our Group companies actively manage water withdrawals at production sites. We receive monthly reports from domestic Group companies and annual reports from overseas Group companies regarding water withdrawals.
Initiatives and track record
■ Water risk and water stress survey
We evaluated water risks and water stress at our production sites using the water assessment tools Aqueduct Water Risk Atlas (*1) and Water Risk Filter (*2).
Although the proportion of freshwater use in regions with high water risk or water stress is low relative to total water withdrawals at all production sites, we recognize the need to manage water use efficiently in accordance with the level of water risk and water stress at each site.
Some of our raw material suppliers are manufacturers that consume large volumes of freshwater in their production processes, and we have begun conducting supplier surveys on this matter.
(*1) A water risk assessment tool developed by the World Resources Institute (WRI)
(*2) A water risk assessment tool developed by the World Wide Fund for Nature (WWF) and Deutsche Investitions- und Entwicklungsgesellschaft mbH (DEG)
Water quality risk
Freshwater withdrawals in regions with “high” or “extremely high” water quality risk accounted for 2% of total freshwater withdrawals across all production sites, while water consumption and production volume in these regions accounted for 0% and 12%, respectively.
|
Water withdrawals (1,000 m³) |
Water consumption (1,000 m³) |
Production volume (1,000 t) |
|
|---|---|---|---|
| Low | 17 | 9 | 66 |
| Low–Medium | 1,156 | 148 | 74 |
| Medium-high | 35 | 19 | 47 |
| High | 5 | 0 | 7 |
| Extremely high | 15 | 0 | 19 |
We referred to Physical Risks Quality of Aqueduct Water Risk Atlas.
Water quantity risk
Freshwater withdrawals in regions with “high” or “extremely high” water quantity risk accounted for 3% of total freshwater withdrawals across all production sites, while water consumption and production volume in these regions accounted for 11% and 25%, respectively.
|
Water withdrawals (1,000 m³) |
Water consumption (1,000 m³) |
Production volume (1,000 t) |
|
|---|---|---|---|
| Low | 0 | 0 | 0 |
| Low–Medium | 22 | 5 | 24 |
| Medium-high | 1,165 | 152 | 137 |
| High | 6 | 0 | 6 |
| Extremely high | 35 | 19 | 47 |
We referred to Physical Risks Quantity of Aqueduct Water Risk Atlas
Water stress
Freshwater withdrawals in regions with “high” or “extremely high” water stress accounted for 4% of total freshwater withdrawals across all production sites, while water consumption and production volume in these regions accounted for 11% and 42%, respectively.
|
Water withdrawals (1,000 m³) |
Water consumption (1,000 m³) |
Production volume (1,000 t) |
|
|---|---|---|---|
| Low | 11 | 5 | 21 |
| Low–Medium | 1,080 | 136 | 86 |
| Medium-high | 89 | 16 | 16 |
| High | 13 | 0 | 43 |
| Extremely high | 35 | 19 | 47 |
We referred to Water Stress of Aqueduct Water Risk Atlas and Water Availability of Water Risk Filter.
■Regional distribution of water withdrawals
In fiscal 2024, freshwater withdrawals at the CMP Group’s production sites totaled 1,228,000 m³. Group companies in Japan—which operate production sites for synthetic resins and chemical products requiring significant volumes of water in their production processes—accounted for the largest share, at 94% of total water withdrawals. The Group also has production sites in regions with high water stress, including China, Thailand, Indonesia, Myanmar and South Korea, which together used 48,000 m³ of water, representing 4% of total water withdrawals. The water withdrawal intensity was 0.5 m³ per ton.
| Water withdrawals (1,000 m³) |
% of total | |
|---|---|---|
| Japan | 1,158 | 94.3 |
| China and South Korea | 40 | 3.3 |
| Southeast Asia | 24 | 2.0 |
| North America | 1 | 0.1 |
| Europe | 5 | 0.4 |
Water risk and stress at production sites
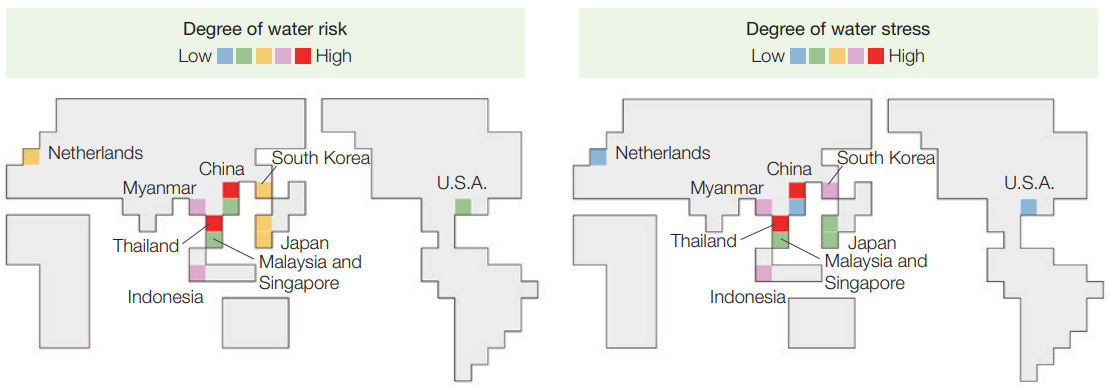
The water risks shown on the map are based on the following indicators from water risk assessment tools.
Water risk: Physical Risks Quantity from the Aqueduct Water Risk Atlas provided by WRI
Water stress: Water Stress from the Aqueduct Water Risk Atlas and Water Availability from the WWF Water Risk Filter
■ Status of freshwater use
All production sites
| 2022 | 2023 | 2024 | ||
|---|---|---|---|---|
| Total water withdrawals (1,000 m³) | 1,242 | 1,160 | 1,228 | |
| Underground water (1,000 m³) | 69 | 64 | 62 | |
| Municipal water (1,000 m³) | 1,172 | 1,096 | 1,166 | |
| Surface water (1,000 m³) | 0 | 0 | 0 | |
| Rainwater (1,000 m³) | 0 | 0 | 0 | |
| Intensity (m³/t) | 6.4 | 6.0 | 5.8 | |
| Total water discharge (1,000 m³) | 1,144 | 1,118 | 1,052 | |
| Ocean (1,000 m³) | 1,012 | 985 | 927 | |
| River, lake, etc. (1,000 m³) | 72 | 81 | 81 | |
| Sewage line (1,000 m³) | 59 | 51 | 43 | |
| Underground/well (1,000 m³) | 1 | 1 | 1 | |
| Others (1,000 m³) | 0 | 0 | 0 | Water consumption (1,000 m³) | 98 | 42 | 176 |
Production sites with high water stress
| 2022 | 2023 | 2024 | ||
|---|---|---|---|---|
| Total water withdrawals (1,000 m³) | 7 | 40 | 48 | |
| Underground water (1,000 m³) | 0 | 3 | 3 | |
| Municipal water (1,000 m³) | 7 | 37 | 45 | |
| Surface water (1,000 m³) | 0 | 0 | 0 | |
| Rainwater (1,000 m³) | 0 | 0 | 0 | |
| Intensity (m³/t) | 0.4 | 0.9 | 0.5 | |
| Total water discharge (1,000 m³) | 6 | 24 | 29 | |
| Ocean (1,000 m³) | 0 | 0 | 0 | |
| River, lake, etc. (1,000 m³) | 0 | 2 | 9 | |
| Sewage line (1,000 m³) | 6 | 21 | 19 | |
| Underground/well (1,000 m³) | 0 | 1 | 1 | |
| Others (1,000 m³) | 0 | 0 | 0 | Water consumption (1,000 m³) | 1 | 16 | 19 |
*Regions with high water stress
2022: Thailand
2023: China, Thailand, and Indonesia
2024: China, Thailand, Indonesia, Myanmar, and South Korea